
DataHive AI
AI • Data Analysis
Decentralized AI data collection platform
DaVinci Graph is an innovative platform designed to revolutionize how data visualization and analysis are approached. By leveraging advanced graph-based technologies, it empowers users to transform complex datasets into actionable insights. With a commitment to innovation and usability, DaVinci Graph bridges the gap between technical experts and everyday users, providing tools that allow businesses and individuals to make data-driven decisions efficiently.
The mission of DaVinci Graph is to simplify data complexity and enhance decision-making by providing clear, interactive, and intuitive visualizations. It is designed to cater to industries like finance, healthcare, and education, where understanding relationships and trends is crucial. By making data intelligence accessible to a broader audience, DaVinci Graph plays a vital role in the increasingly data-driven global landscape.
DaVinci Graph is a state-of-the-art data visualization and analysis platform designed to address the growing need for intuitive, graph-based tools that simplify data complexity. Since its inception, the platform has focused on providing users with the ability to uncover hidden patterns, track dependencies, and understand relationships in datasets. Its innovative approach has made it an essential tool for businesses, researchers, and industries looking to make informed decisions through data-driven insights.
At the heart of DaVinci Graph is its proprietary graph visualization engine, which allows users to interact with data in real time. This engine makes it easy to spot correlations, explore trends, and identify key insights. Over time, the platform has incorporated features like machine learning integration, real-time data processing, and customizable dashboards, ensuring flexibility for various applications. These features make DaVinci Graph an indispensable resource for industries like healthcare, where understanding complex data relationships is vital, and finance, where analyzing trends and risks is key.
DaVinci Graph also excels in integrating with existing tools. Its compatibility with industry-leading platforms such as Tableau and Power BI ensures that businesses can seamlessly incorporate its capabilities into their workflows. Additionally, DaVinci Graph competes with other visualization tools like Neo4j and Gephi, distinguishing itself with a strong focus on user experience, enterprise-grade scalability, and customization.
Throughout its development, DaVinci Graph has achieved several milestones, from securing partnerships with leading organizations to expanding its feature set to meet the growing demands of the data analytics industry. As the need for data-driven decision-making continues to grow, DaVinci Graph remains a trailblazer, setting the benchmark for excellence in the field. Learn more about its offerings at DaVinci Graph’s official website.
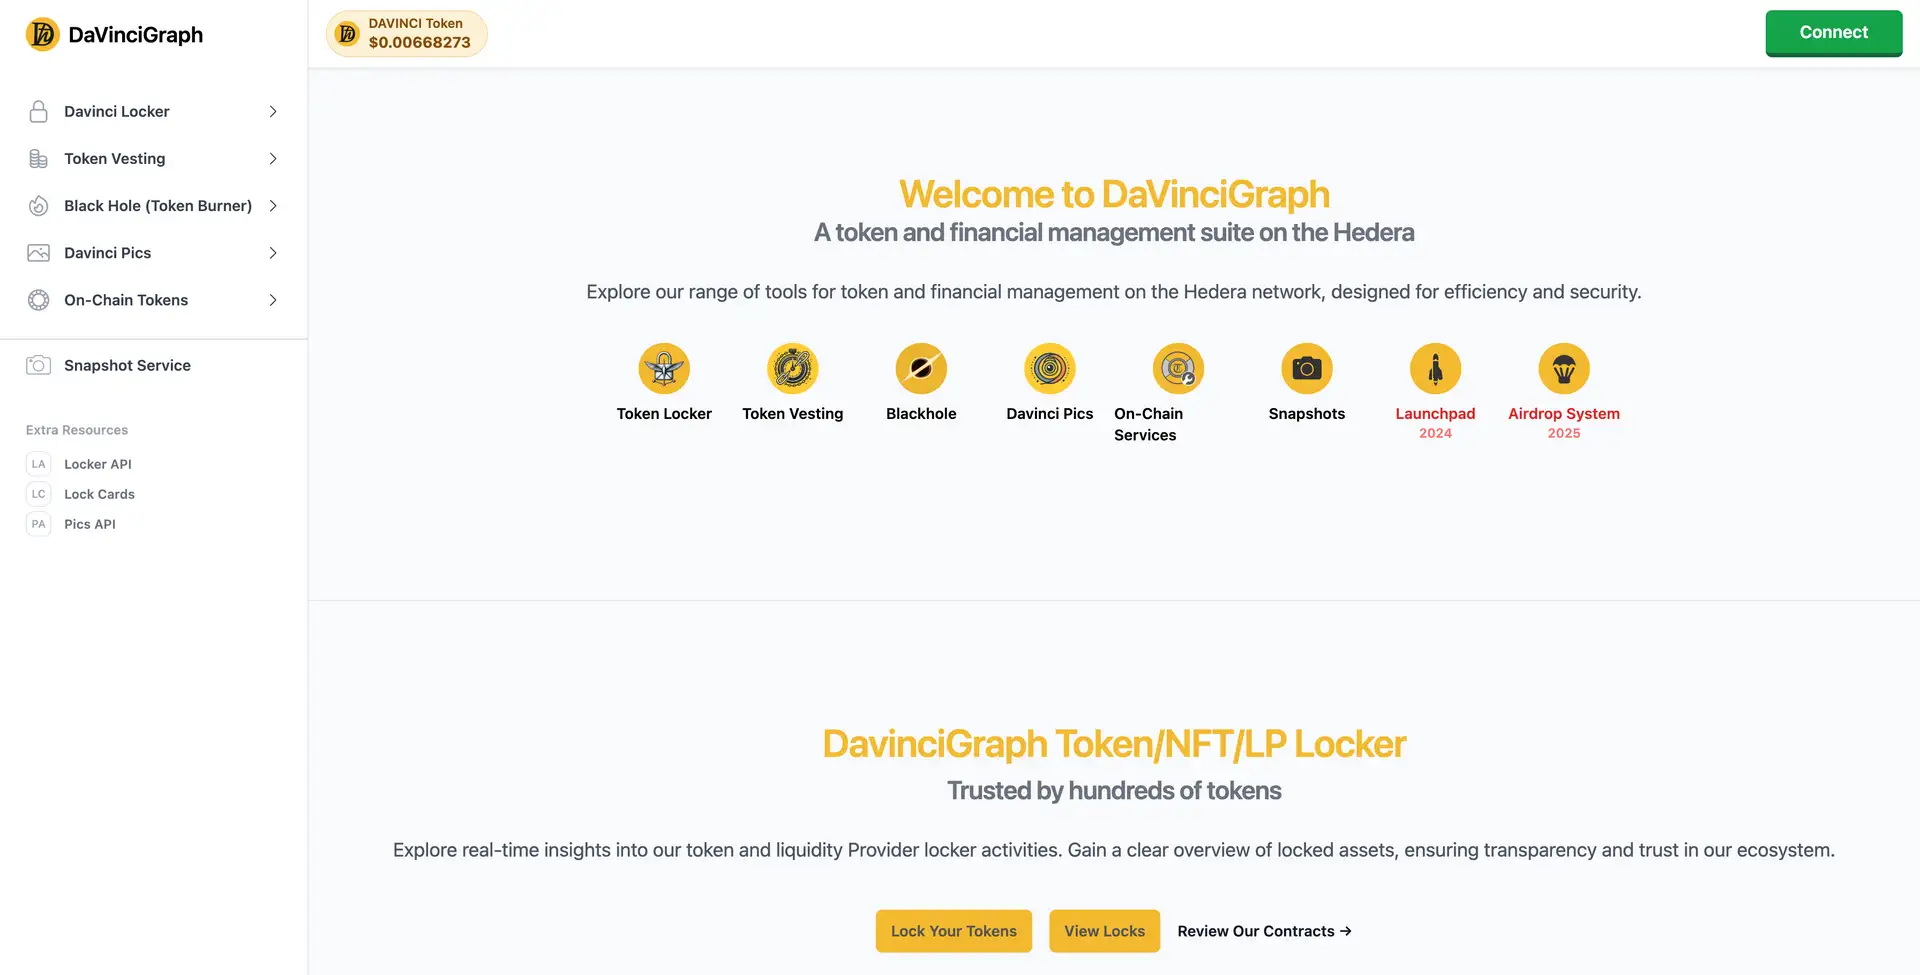
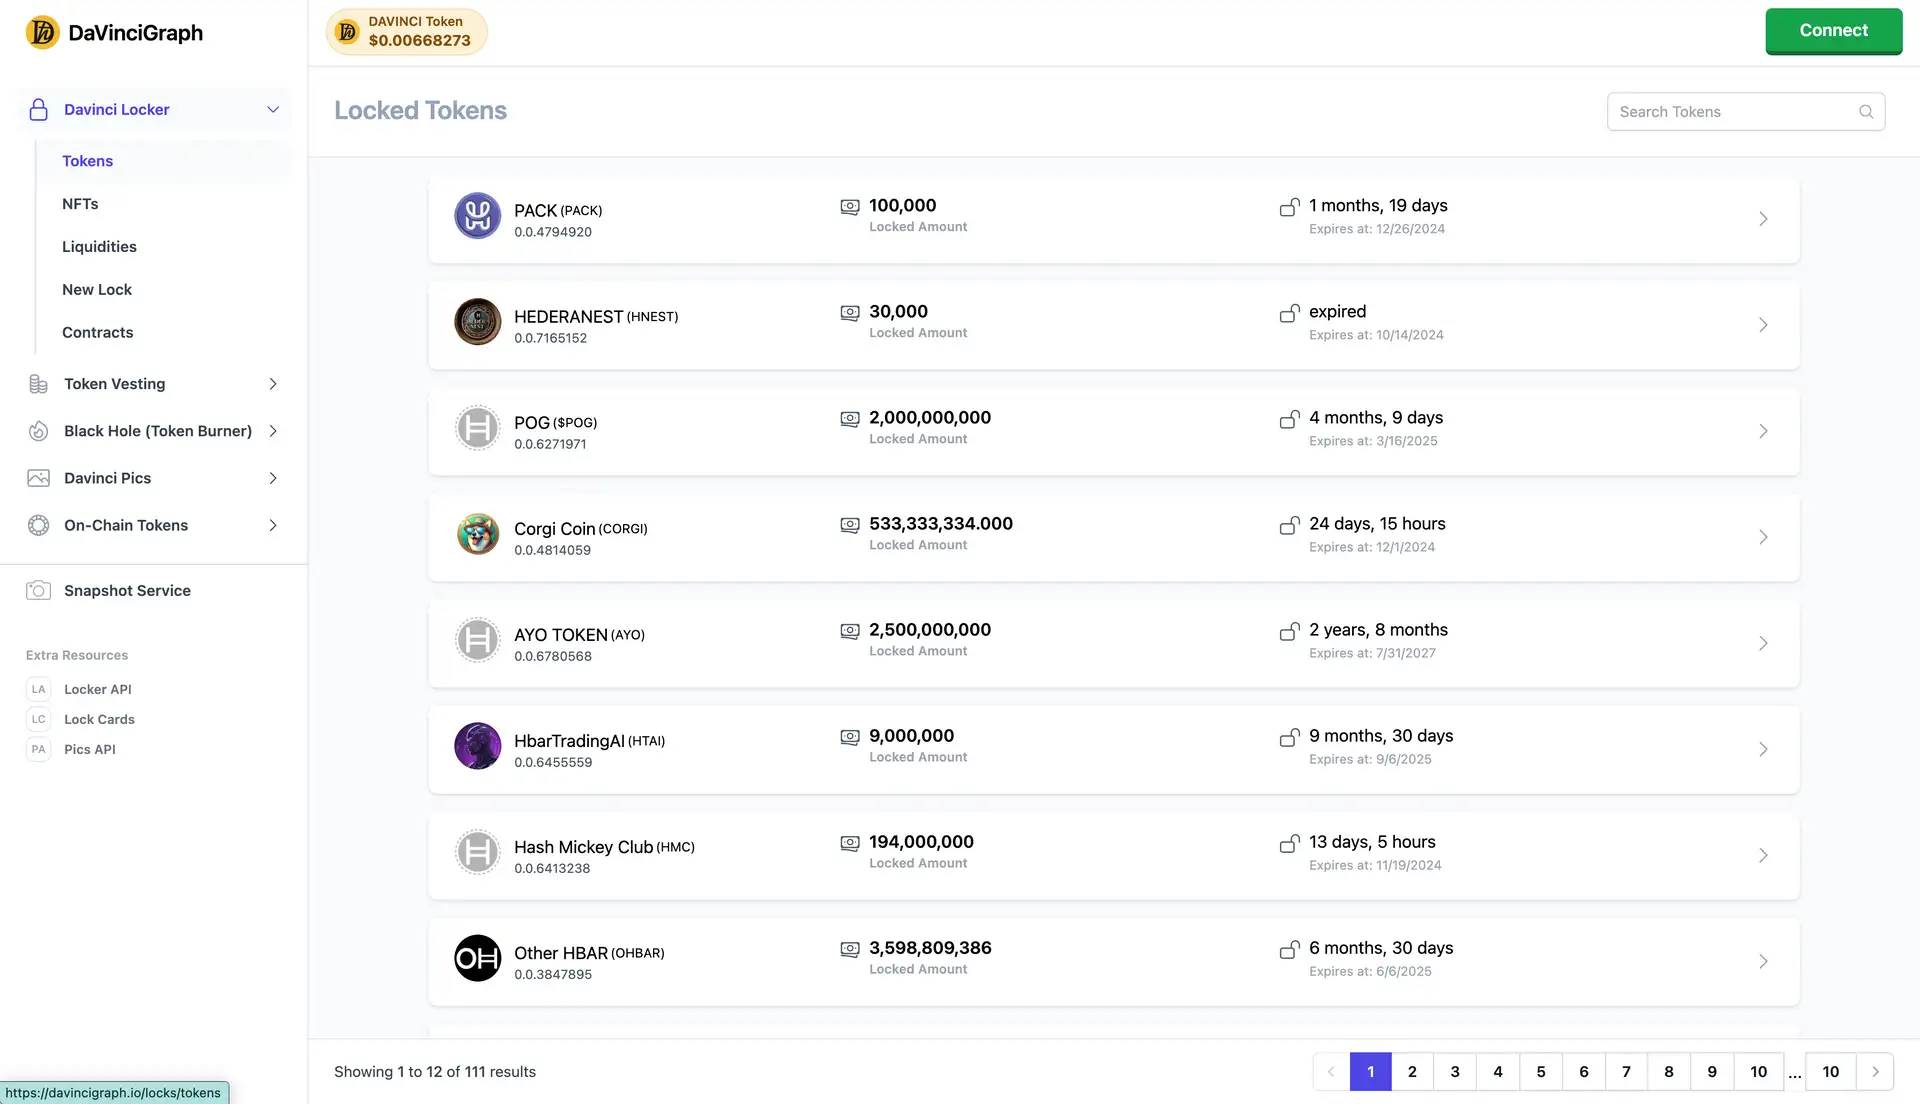
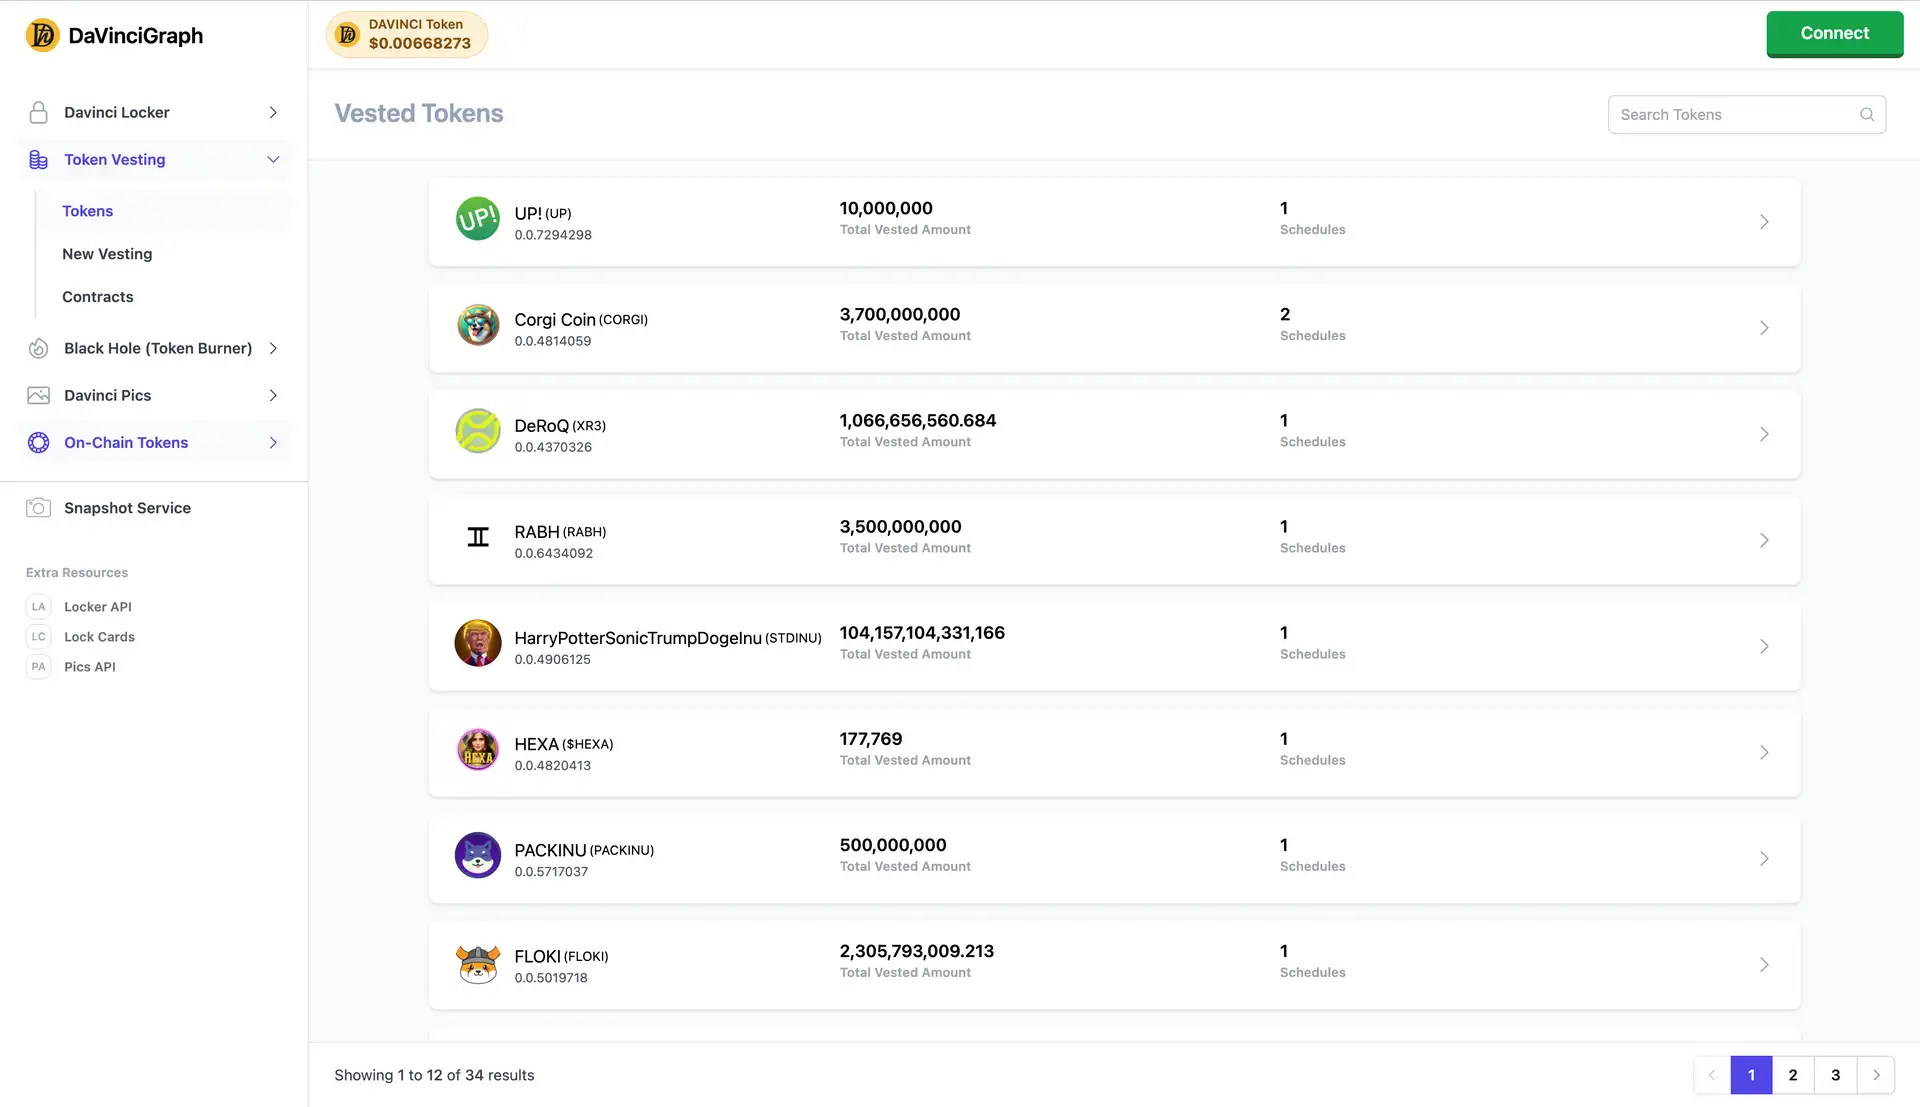
DaVinci Graph offers an extensive array of features that make it a top-tier solution in the world of data visualization and analysis. Below are its most significant benefits and features:
Getting started with DaVinci Graph is simple and designed to cater to users of all experience levels. Follow these steps to begin:
DaVinci Graph processes real-time data by leveraging advanced data ingestion pipelines and graph visualization engines. These pipelines allow the system to handle live data streams with minimal latency, ensuring that users receive up-to-date insights. Built-in error-checking algorithms and redundancy mechanisms ensure data integrity, even in high-velocity environments.
Industries that rely on understanding complex relationships within their datasets, such as finance, healthcare, and logistics, benefit significantly from DaVinci Graph. For instance, financial analysts can track transaction networks to identify anomalies, while healthcare researchers can analyze patient data to discover treatment patterns.
DaVinci Graph supports integration with both legacy systems and modern tools like Tableau and Power BI. Its API-first architecture ensures seamless data flow between older systems and state-of-the-art analytics platforms, helping businesses modernize without disrupting their workflows.
Data security is a top priority for DaVinci Graph. It employs robust encryption protocols, role-based access control, and compliance with standards like GDPR and ISO 27001. These measures ensure that sensitive data is protected at every stage. For enterprise users, custom security configurations are available.
DaVinci Graph offers a wide range of visualizations, including network graphs, tree structures, heatmaps, and more. Each visualization is fully customizable, allowing users to adjust parameters like node size, color schemes, and data layers to fit their unique datasets.


